Description
On a bright, sunny day the sun shines approximately 1,000
watts of energy per square meter on the planet's surface. There are two basic
methods for harnessing this power – solar thermal collectors and photovoltaic
cells.
 |
Solar thermal collectors focus the heat of the sun and
use it to heat water, creating steam, which is used to turn a generator. |
 |
| |
|
|
 |
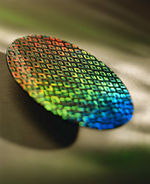
Photovoltaic cells use semiconductors (materials like
silicon) to absorb some of the light, in the process knocking a few electrons
free. Electricity is basically a bunch of these free moving electrons. |
 |
United States
Although higher in 1999 than in 1993, solar energy consumption
declined 1 percent to 74 trillion Btu between 1998 and 1999. Most of this
was in the residential and commercial sector, where some older equipment reached
the end of its useful life of 20 years. Most grid-connected solar electricity
generation occurs at nonutility facilities, where generation decreased slightly
in 1999 to 893 million kilowatthours. Utility solar generation increased over
the same period, but at 3.5 million kilowatthours it remains a negligible
share of total renewable generation. Ninety-four percent was generated in
California.
|
U.S. Utility Net Electric Generation
from Solar Energy, 1999
|
|
Utility Plant
(State)
|
Net
Generation
(Thousand Kilowatthours)
|
|
Sacramento Municipal Utility District Solar (California)
Sacramento Municipal Utility District Hedge PV (California)
Austin Electric Decker Creek (Texas)
Pacific Gas & Electric PVUSA 1 (California)
|
1,947
310
212
1,012
|
|
Total
|
3,481
|
Note: Net generation is gross
generation minus plant use.
Source: Energy Information Administration, Electric Power Monthly May
1999, DOE/EIA-0226(99/05) (Washington, DC, May 1999), Table 58. |
Solar Collector Manufacturing
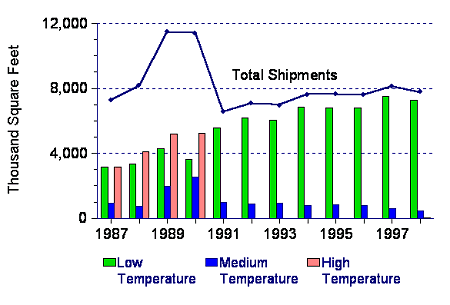
The United States also manufactures a large portion
of the world’s solar collectors. Low-temperature solar collectors represented
94 percent of total US shipments, while medium-temperature collectors were
responsible for almost 6 percent. High-temperature collectors are used by
utilities and nonutilities in experimental grid electricity programs and represent
less than 1 percent of total shipments. U. S. manufacturers from 6 states
(California, New Jersey, Florida, Hawaii, Texas, and New York) and Puerto
Rico manufactured nearly 100 percent of U.S. solar thermal collectors in 1998.
Shipments included both components and integrated solar collector systems.
|
U.S. Solar Collector Shipments
1987 to 1998
|
|

|
|
Source: Energy Information Administration, Form EIA-63A,
“Annual Solar Thermal Collector Manufacturers Survey.”
|
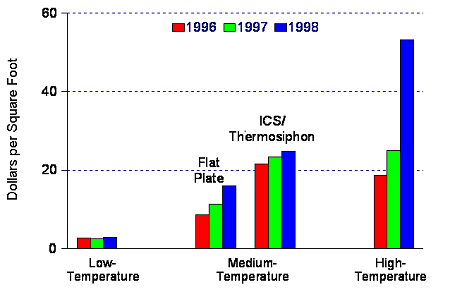
The average price for total shipments increased 3 percent,
from $3.56 per square foot in 1997 to $3.66 per square foot in 1998. Low-temperature
collectors registered an increase in total value of 5.2 percent, from $19.6
million to $20.6 million. This was due principally to an 8.8-percent increase
in the average price for low-temperature collectors, from $2.60 per square
foot in 1997 to $2.83 per square foot in 1998. This increase was due primarily
to rising material costs.
|
U.S. Average Price of Solar Thermal
Collector Shipments 1996, 1997 and 1998
|
|

|
|
Source: Energy Information Administration, Form EIA-63A,
“Annual Solar Thermal Collector Manufacturers Survey.”
|
Now let’s take a look at Wind power. |